KrigR: a tool for downloading and statistically downscaling climate reanalysis data
A reproducible route from ERA5 reanalysis to locally relevant climate data, developed with Erik Kusch.
Research / Climate Information & Decision Support
Turn large datasets into inspectable metrics, maps and interfaces, while keeping uncertainty and limitations in view.
Climate information becomes useful when it is designed around the question someone needs to answer. A park manager, a researcher and a reader examining a carbon claim may need very different quantities from the same underlying climate evidence.
KrigR, developed with Erik Kusch, supports downloading and statistically downscaling ERA5 reanalysis. The distinction between more grid cells and more information is essential: a high-resolution result still depends on covariates, data quality and the assumptions of the method.
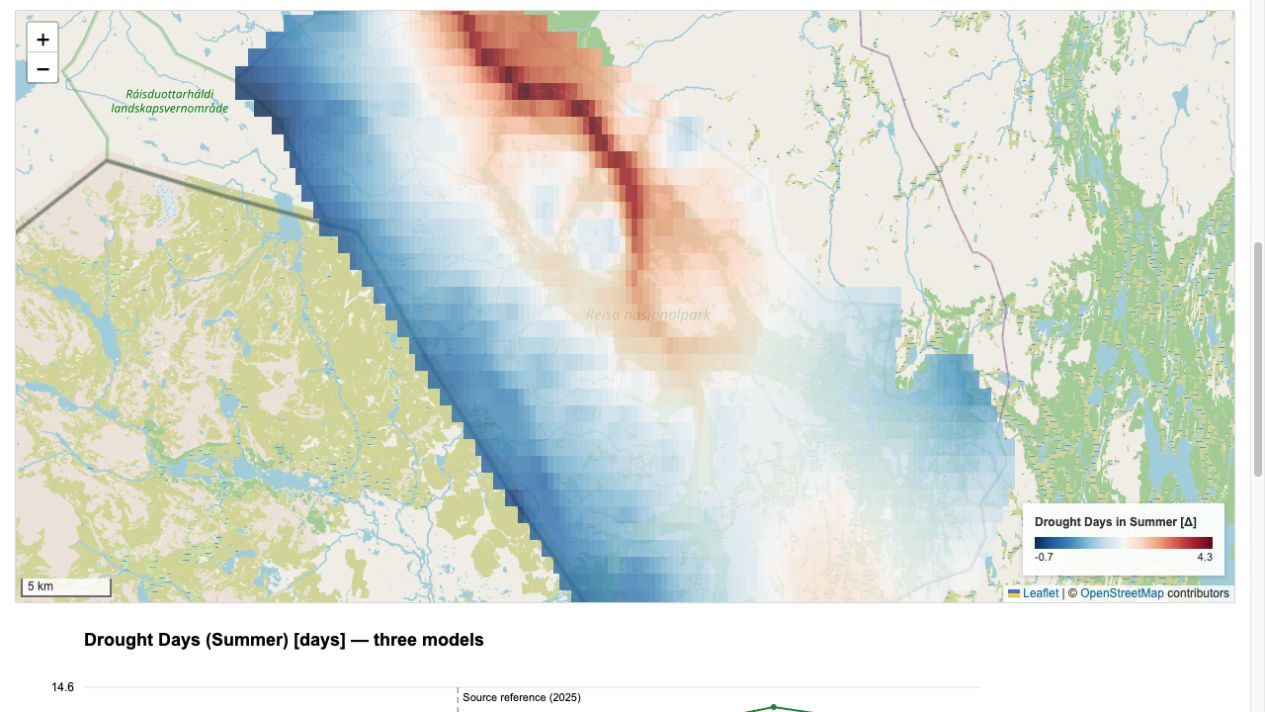
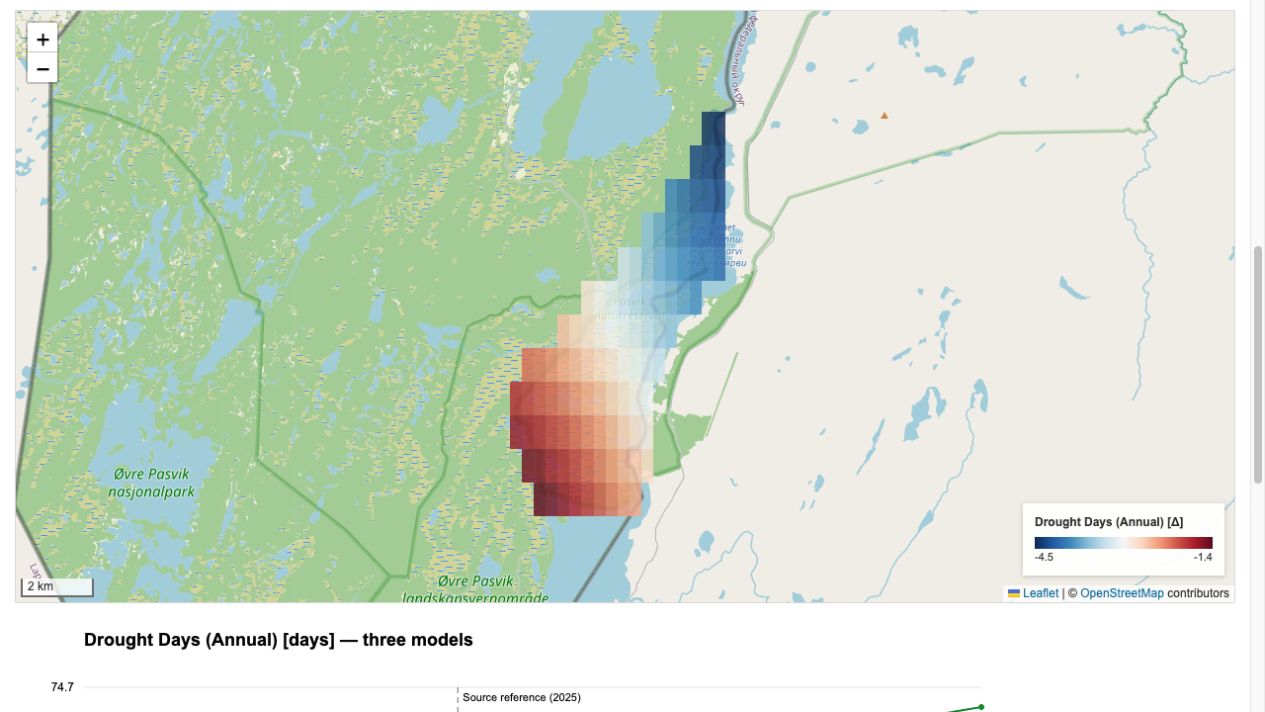
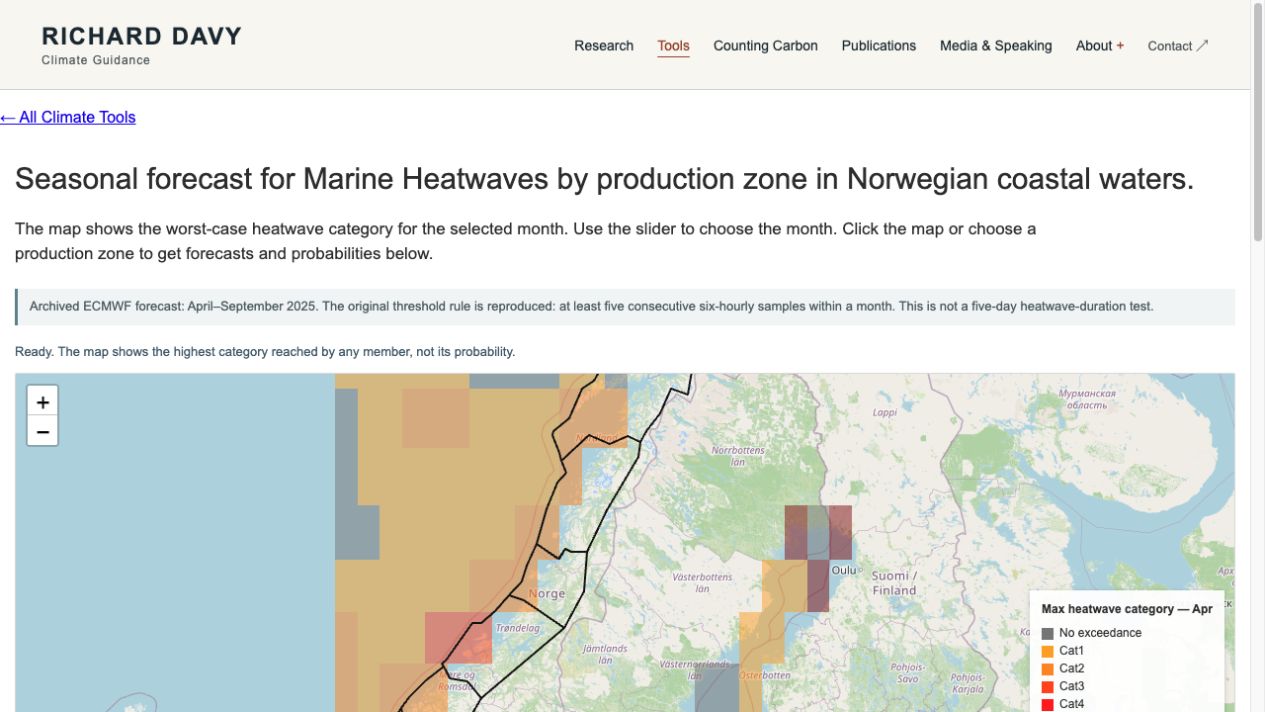
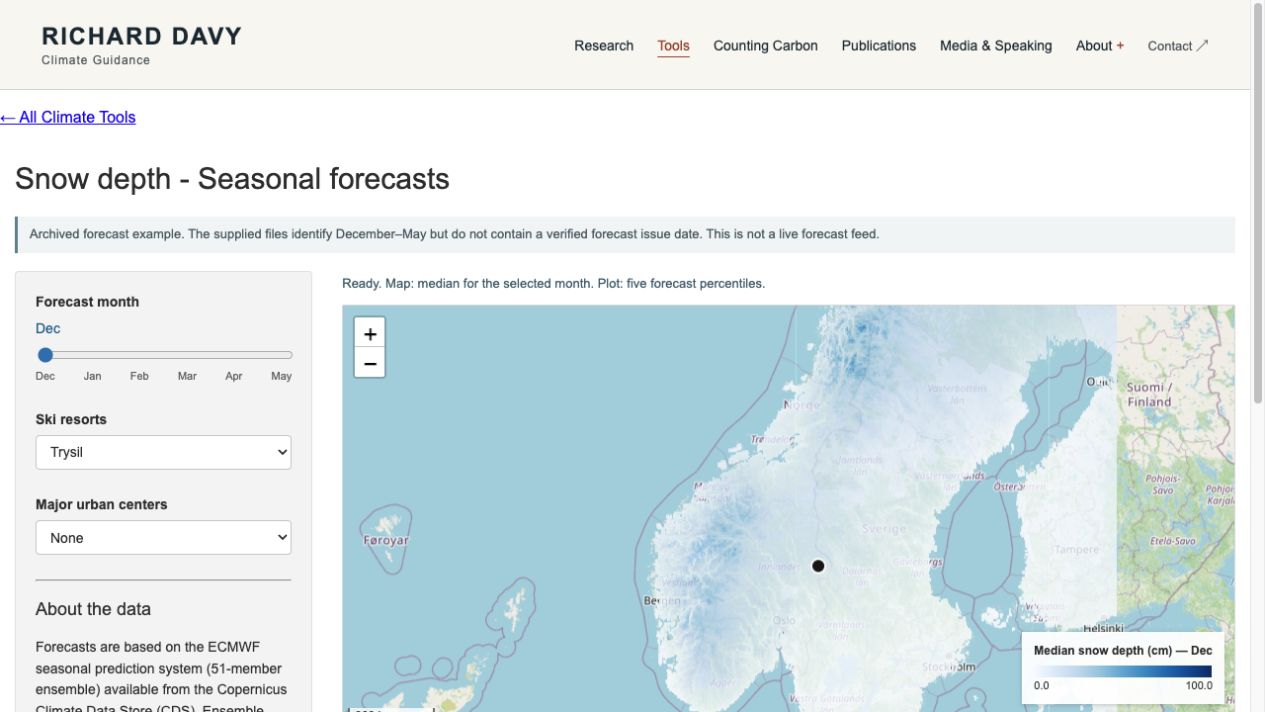
The protected-area explorers retain model cases, time windows and definitions alongside maps and time series. The snow and marine interfaces show ensemble information; their archive periods and prototype status are shown alongside the results.
The Reisa and Pasvik tools carry CLAP / Interreg Aurora attribution. The gallery links each interface to its method and scope so visitors can judge what it can support.
Research record
A reproducible route from ERA5 reanalysis to locally relevant climate data, developed with Erik Kusch.
From evidence to exploration
Basemap © OpenStreetMap contributors
How do climate indicators change across future periods?
CNRM, ICHEC and IPSL model cases; supplied park grid and 1970–1990 baseline.
CLAP / Interreg Aurora. Interpret the screening categories alongside the stated thresholds and local evidence.
Basemap © OpenStreetMap contributors
Which changes matter for river access, birdlife and fire indicators?
Park-scale indicators, model cases and future-minus-baseline changes.
CLAP / Interreg Aurora attribution; original threshold assumptions are explained.
Basemap © OpenStreetMap contributors
How does heatwave-category risk vary by coastal zone and month?
51-member ECMWF ensemble, Norwegian production zones.
April–September 2025 snapshot. Original five-six-hourly-sample rule retained and labelled.
Basemap © OpenStreetMap contributors
How wide is the forecast range for a resort or location?
ECMWF seasonal ensemble; five percentiles and native-grid point queries.
Archived December–May example; issue date unverified.